The reason for this division is the fact that it will not do any good to have a fast library, if it is not good at training.
The libraries will be tested both for quality and for performance. Part of this test will be on a hand-held Compaq iPAQ H3600 with a 206 MHz Intel StrongARM processor, which excels in the fact that it does not have a floating point processor and only has a 8 KB cache consisting of 256 cache lines of 32 bytes. The rest of the benchmarks will be run on a workstation AMD Athlon XP 1600+ machine (actually only 1400 MHz) with a 256 KB L2 cache and a 128 KB L1 cache. Both machines use the Linux operating system.
I have downloaded several other ANN libraries, but most of them had some problem making them difficult to use. Either they where not libraries, but programs [Anguita, 1993], [Zell, 2003], they could not compile [Software, 2002], or the documentation was so inadequate that is was not possible to implement the features needed in the benchmark [Darrington, 2003].
Even though I will only benchmark two libraries besides the fann library, I still think that they give a good coverage of the different libraries which are available. I will now briefly discuss the pros and cons of these two libraries.
Part of the jneural library is an architecture designed to load training data from a file. This feature is a big help when training an ANN and should be a feature included in all ANN libraries.
The library internally implements an ANN as a lot of linked objects, which make for very poor cache performance. In its original form jneural used double precision floats, but I have altered it to use single precision floats, in order to compare it to the other libraries. The library used in the benchmarks is version 1.05 from 2002.
I have used this library on several occasions, most recent in [Nissen et al., 2003], where the library was trained on a normal PC and executed on an iPAQ.
The library is in active development and has gone from version 0.3 to version 0.6 while I have implemented the fann library. Version 0.6 is used in the benchmarks.
The library has a good compact architecture and is highly optimized. E.g. the sigmoid activation function is implemented as a lookup table.
Another problem is finding good datasets. ANN libraries perform different on different datasets, meaning that just because one library is better at one problem does not mean that it is better at another problem. For this reason quality benchmarks should be run on several different datasets. The datasets themselves should include both training and testing sets, to allow checks for over-fitting.
It is possible to make artificial datasets, but they very seldom reflect the kind of problems ANNs are faced with when they are used. For this reason many different databases with real ANN problems have been created, [Blake and Merz, 1998] being the largest. I have looked at several different sources of datasets, before I decided to chose the datasets delivered by Proben1 [Prechelt, 1994]. Proben1 delivers 12 different datasets, divided in two different categories, classification and approximation. These problems have been benchmarked with several different training methods and suggestions for network sizes have been given. I chose the Proben1 datasets because the problems are very differentiated and well documented.
 |
The Proben1 datasets are separated with 50% for training, 25% for validation and 25% for testing. I will however not do validation while training and have for this reason decided to use both the validation and test sets for testing.
I will do the quality benchmarks by training ANNs with training sets for a fixed period of 200 seconds. During this period I will regularly stop the time in order to write information about the mean square error for the training data and the testing data to a file. Preferably once every second but since I will only stop training between two epochs, this can not always be accomplished. To calculate the mean square error I will use the same function on all the different libraries, to make sure that differences in this calculation does not affect the result.
I will use this data to create graphs which plot the mean square error as a function of the time. I will create one graph for each of the datasets. On these graphs I will plot the training and testing error for the jneural library, the lwnn library, the fann library with single precision floats and the fann library where connection rate is set to 0.756. I will only plot data for one training session with each library, but I will run other smaller training sessions to ensure that the selected session is representative.
The mean square error of the training and testing data, executed on the fixed point version of the fann library will also be included on these graphs. This however needs a little bit of explanation: Every time I stop the time to print the mean square error for the fann library, I will also save the ANN to a fixed point configuration file. After the training has finished I will read each of these configuration files, with the fixed point library and calculate the mean square error for the training and testing data. This info will then be plotted on the graph.
I will sum up all of the benchmarks in figure 22, to give a quick overview of how well the libraries performed. The programs used for benchmarking the quality of the libraries is included in appendix B.3.1 and B.3.2.
 |
 |
 |
 |
 |
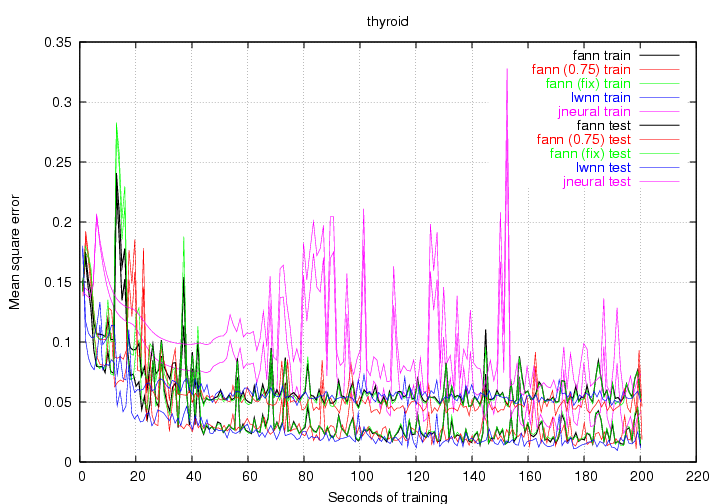 |
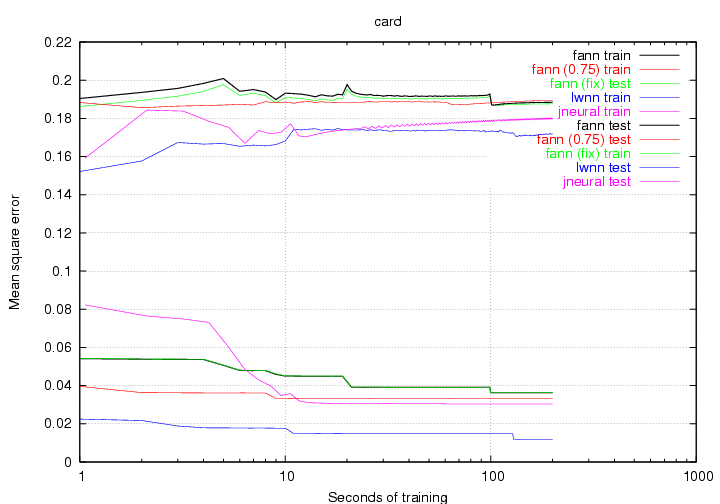
Figure 16 to 21 show the benchmark graphs the different problems. Some of the graphs are shown on logarithmic scales to make it easier to see the differences between the libraries. Some of the plots do not start and end at the same time. This is because I have only allowed for testing of the networks between epochs and since some of the training sets where quite large (especially mushroom), the first epoch could take several seconds.
It is expected that the test data performs worse than the training data, which is why the plot for the test data will be located higher than the plot for the training data. With this in mind, I have chosen to plot both test and training data in the same color to make the graphs easier to look at. I will now briefly discuss the results of the individual benchmarks.
It is worth noticing the fact that the fixed point version is slightly better than the floating point version. This behavior was repeated multiple times, but I can not find a reasonable explanation to why this behavior can be repeated. Some of the other benchmarks also show this behavior.
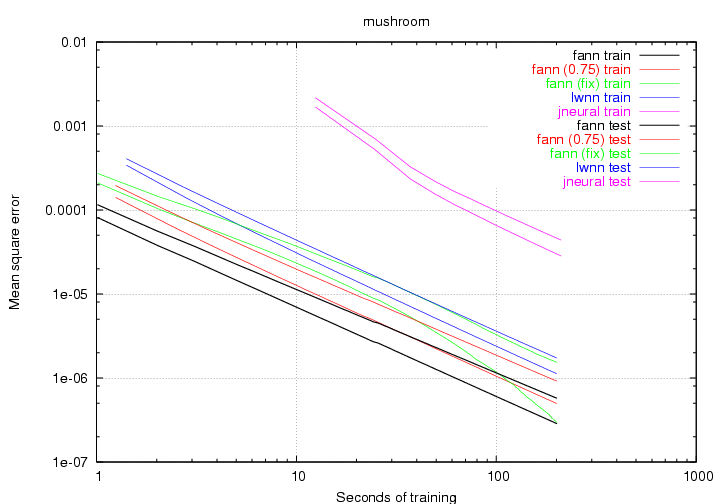
The spiked look of the graphs suggests that perhaps gradient descent training methods are not the best way of training ANNs with this problem. Another optimization method like e.g. simulated annealing would probably do a better job.
 |
Figure 22 shows a summary table of all the different runs and although there is not an obvious winner, there is an obvious looser. The jneural library is clearly slower than the other libraries and does not manage to reach as low a mean square error as the other libraries.
The lwnn library seems to be the second worst library, but much of this is due to the fact that it did a very poor job on the gene problem. When looking at the other problems it does a fairly good job (especially on the card problem). The library is a little bit slower at learning than the fann library (44995 epochs compared to 76591), which explains why it does not get as low a mean square error for some of the easier problems like mushroom and building.
This leaves the three versions of the fann library: The standard fann library has the lowest mean square error for the training data, the fann library with a connection rate of 0.75 has the lowest mean square error for the testing data and the fixed point fann library has the lowest total mean square error.
The standard fann library does a really good job on most of the problems. It is also the library which manages to train for the most epochs. It only has one set of data, where it finishes last and this is the test data for the soybean problem. But the difference between the libraries on this set of data is so small that it really does not matter.
The fann library with a connection rate of 0.75, is a bit better at generalizing than the standard fann library, but there is no clear tendency. Surprisingly it does not manage to train for as many epochs as the standard fann library, but it is probably due to the fact that the standard fann library uses optimizations for fully connected networks.
To my big surprise, the overall winner was the fixed point version of the fann library. I will however say that it must be a coincidence that it is better than the standard fann library because the fixed point library uses the weights stored from the floating point library. It is however not a coincidence that the fixed point fann library is just as good as the floating point fann library. When looking at the datafiles saved by the floating point library, it is possible to see which positions of the decimal point that are used. Throughout all of the benchmarks the decimal point has been in the bit position range 10 - 13, these bit positions give plenty of accuracy to execute an ANN.
From these observations I can conclude that the fixed point implementation has proven that it can perform just as good as a floating point library. Though it is not possible to conclude that it will always perform this well. Some problems may give rise to very high weights, which will give a lower accuracy for the fixed point library.
The final conclusion must be that both the lwnn library and the fann library does a good job on these problems. I suspect that with tweaking of parameters these two libraries will perform well on most ANN problems.
The first benchmark will be run on the AMD Athlon machine and the second benchmark will be run on the iPAQ.
The configurations of the fann library which I will use are the normal fann library with the sigmoid activation function, the fann library with the threshold activation function (hereafter known as fann (thres)), the fixed point fann library (hereafter known as fann (fix)) and a version of the fann library which does not use the performance enhancements for fully connected networks (hereafter known as fann (noopt)). The reasons for choosing these configurations are:
I will measure the performance for several different sizes of ANNs. These different sized ANNs will consist of four layers with the same amount of neurons in each. The amount of neurons in the layers will be doubled for each run starting with only one neuron. With these four layers, the total amount of connections in an ANN without bias neurons (only lwnn) will be ![]() , where
, where ![]() is the amount of neurons in the layers. For an ANN with bias neurons (jneural and fann) the total amount of connections will be
is the amount of neurons in the layers. For an ANN with bias neurons (jneural and fann) the total amount of connections will be ![]() .
.
For each network size, the network will be executed consecutive for 20 seconds. After this time the number of nanoseconds used for each connection will be calculated. The two benchmarks will produce one graph each, furthermore I will include tables showing the performance of layer sizes which are of particular interest. The program used for benchmarking the performance in the libraries is included in appendix B.3.3.
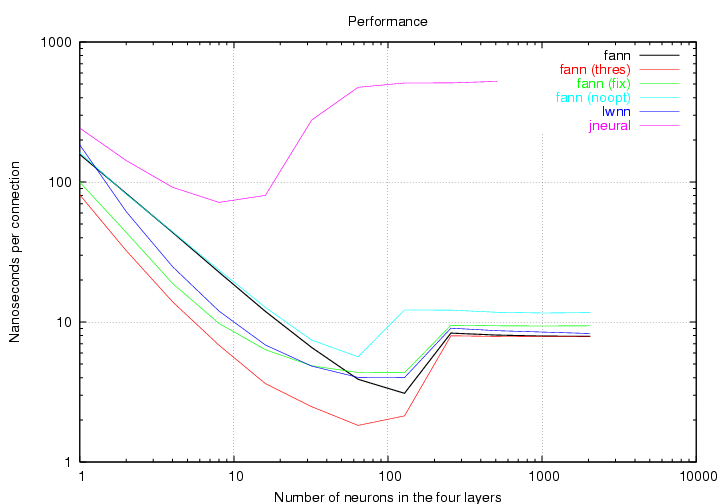 |
Figure 23 shows the benchmark for the libraries on the AMD Athlon machine. Before describing which library is the fastest, I will describe the shapes of the plots. All of the plots have a characteristic S shape, which start high then goes low before going high again. The reason why the plots start high is that, for small network sizes, the per neuron overhead is rather high compared to the time used on the connections. As ANNs become larger, the inner loops will run for more iterations, thus making the overhead smaller. If good cache optimization is applied, the ANN will run very smooth and all the CPU time will be used for actually calculating the sum function. At some point the ANNs become so large, that they can no longer fit in the cache, which on the AMD Athlon is 256 KB. When this happens, the performance declines and the plots go up again. The fann and lwnn library both hit the cache boundary between layer sizes of 128 and 256. This is the optimal place, since the amount of space needed to represent the weights in an ANN with layer sizes of 128 and 256 is approximately 190 KB and 770 KB (when using four bytes for each weight). The fann (noopt) configuration of the fann library hits the cache boundary before, because it needs to access memory containing information about the connections. Where the jneural library has no optimizations for cache and therefore hits the cache boundary a lot sooner.
A brief look at the graphs shows that the jneural library has the lowest performance and that the fann (thres) configuration performs best. The fann (noopt) configuration performs slightly worse than the three remaining libraries (lwnn, fann and fann (fix)), but between these libraries performance varies for different network sizes.
I have chosen three different layer sizes, which I will study in detail to see how fast the individual libraries are. For each of these sizes I have made a table showing how fast the libraries are.
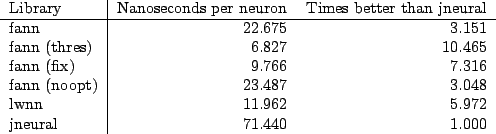 |
Figure 24 shows a table for the performances of ANNs with 8 neurons in each layer. This is the layer size where the jneural library performs best. Unfortunately it still uses more than three times as much time as the rest of the libraries. The fann (noopt) configurations is only slightly slower than the fann configuration, which comes from the fact, that there is still plenty of free cache. The lwnn library is faster than the fann library, which is probably due to the fact that it uses a precalculated table for calculating the sigmoid function. Using a table for the sigmoid function greatly reduces the per neuron overhead and gives the lwnn library a performance increase on the small ANNs. The fixed point library performs quite well for these smaller problems and proves that the fixed point library can also increase the performance on computers with floating point processors. This is probably because the stepwise linear activation function is faster than the sigmoid activation function. The fann (thres) configuration is the fastest configuration and it is more than three times as fast as the normal fann library, which suggests that the sigmoid function uses two third of the fann library's time. This observation clearly suggests, that creating a fast sigmoid implementation is a good way of optimizing an ANN library.
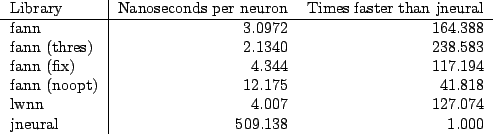 |
Figure 25 shows how well the libraries performs with 128 neurons in each of the four layers. This is an indication of how the libraries perform at a stage where the jneural and fann (noopt) libraries have already reached the cache boundary, but the others have not. At this point the fann (thres) library is 238.583 times faster than the jneural library and the fann library is 164.388 times faster than the jneural library. This is a clear indication of the benefit which can be reached through performance engineering.
Another interesting observation is that the standard fann library is faster than the fann (fix) and lwnn libraries. I think this is due to the fact that both of these libraries use variables which are stored in memory for calculating their sigmoid functions. These variables will most likely have been erased from the cache at the point where the sigmoid function should be calculated, hence resulting in a cache miss. On the AMD Athlon a cache miss takes longer time than calculating the sigmoid function, which in effect makes the fann library faster than the two other libraries.
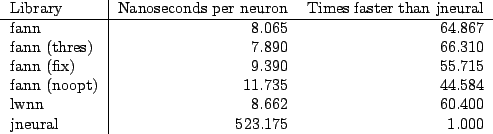 |
With a layer size of 512 neurons (figure 26), all of the libraries have reached the cache boundary. The jneural library is also close to the limit for how many connections it can handle without being killed by the system. I did not really investigate further into why it was killed by the system, but it probably took up too many resources. At this point the fann library is 64.867 times faster than the jneural library, which is not as much as before it reached the cache boundary, but it is still a huge performance increase.
With this large layer size, there is very little penalty of calculating the sigmoid function and the fann (thres) library is only slightly faster than the normal fann library. The lwnn library, which uses a table lookup for the sigmoid function, is now slower than the fann library and so is the fann (fix) library. The fann (noopt) library is still slower, but the difference is no longer as severe.
 |
Figure 27 shows the performance graph of the benchmarks run on the iPAQ. The first thing which is noticed, is the fact that the plots do not have an S shape. This is because there is only a small amount of cache on the iPAQ and that this cache is not suited for storing large arrays. Much of the cache is probably occupied by the operating system. The bottleneck on the iPAQ is the CPU running at 206 MHz and without a floating point unit. This makes the sigmoid function very hard to calculate and if we look at results for the smaller networks on the graph the plots are divided in three groups.
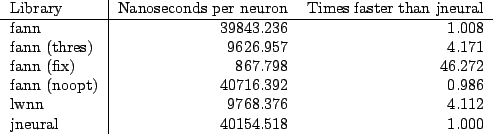 |
Figure 28 clearly shows the three groups that the plots are divided into. The first group consists of the fann, fann (noopt) and the jneural library. These three libraries all need to calculate the real sigmoid function. The second group consists of the fann (thres) and lwnn libraries which does not need to calculate the real sigmoid function and therefore is faster. The last group consists of the fann (fix) library, which is much faster than the other libraries because it uses fixed point numbers.
 |
At a layer size of 128 (figure 29) the per neuron overhead is not as important and neither is the time it takes to calculate the sigmoid function. What is important, is how much the library uses floating point calculations. The fann (fix) library uses no floating point calculations when executing the library and hence receives a huge performance benefit. The fann (fix) library is almost 70 times faster than the jneural library and more than 40 times faster than the lwnn library, which really is a noticeable performance increase.
A surprising thing, which is visible on these figures, is how close the plot for the standard fann library is to the plot for the jneural library. This means that all the optimizations made to the fann library has very little influence on how fast it performs on the iPAQ. Had I not made the fixed point optimizations, then this would truly have been a depressing benchmark.
It is difficult to tell which library is the fastest and most accurate, when comparing the standard fann library and the lwnn library. The lwnn library is faster at the smaller problems due to a highly optimized sigmoid function, while the standard fann library is faster at the larger problems due to optimized inner loops and cache performance. These benchmarks makes it easier to choose a library, when you know which kind of problem you should solve.
Many different optimizations where made in the fann and lwnn libraries, but when observing differences between figure 23 and figure 27, three optimizations appear to be most efficient.
A lot can be learned from these benchmarks. I will now discuss some of these learnings and suggest ways of improving the fann library on the basis of these learnings:
The sigmoid function takes a long time to calculate and optimizations on the time used for this function should be implemented in the fann library.
Sparse connected ANNs have serious performance problems in the fann library. For this reason they should be used with care, but still it seems like smaller sized ANNs could receive extra performance by decreasing the number of connections.
Cache performance is very important for the execution time of ANN libraries, perhaps further improvements could be received by looking even closer at the memory accessed by the fann library.
Steffen Nissen 2003-11-07